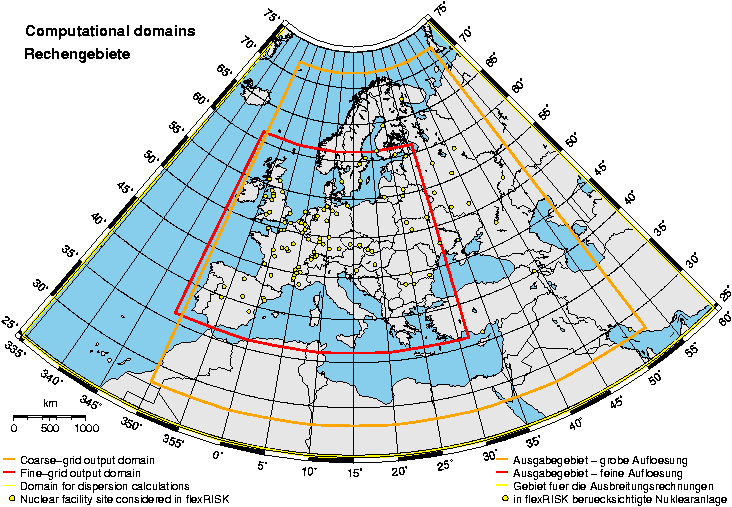
Domains of the Project flexRISK
The map shows the three domains used in the project. The outermost domain (yellow line) shows the boundaries for the meteorological calculations. The next domain boundary (in orange) defines the region for evaluation of the results in a 1x1 degree grid. In the region inside the smallest domain (red line) results will be evaluated on a finer grid.